Model Foundry
MLOps Observability Platform
A unified platform for discovering, monitoring, and governing machine learning models across their complete lifecycle
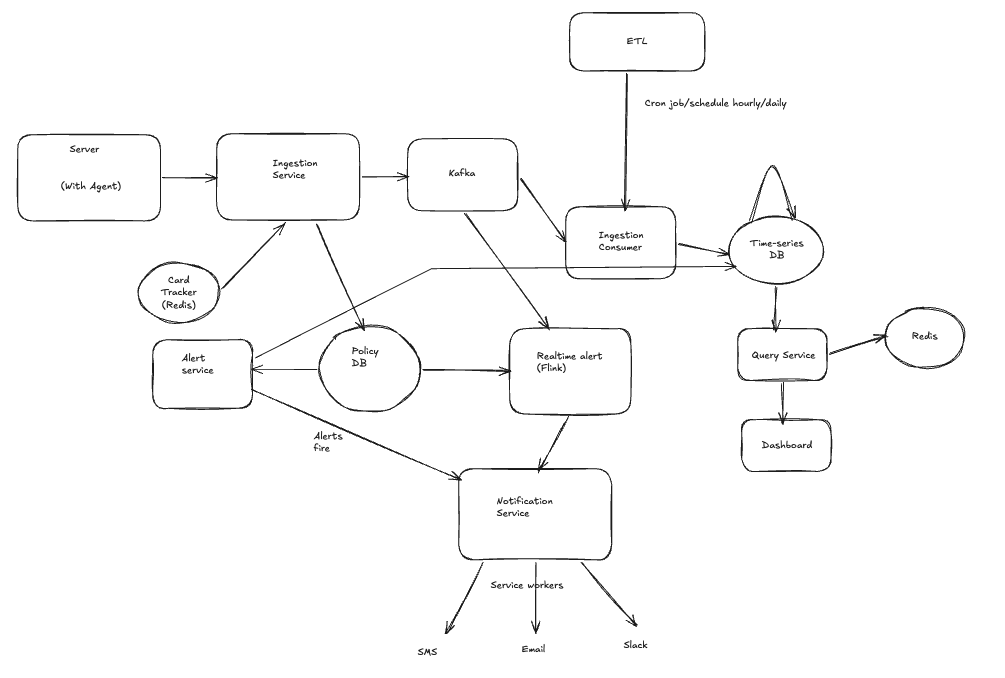
High-Level Technical Design
MLOps observability architecture and data flow at a glance
Architecture Highlights
- Unified observability layer for models, features, and data
- End-to-end lineage from training artifacts to serving health
- Standardized telemetry contracts across ML services
- Actionable ownership, compliance, and freshness signals
- Scalable architecture to support high-cardinality monitoring
Design Intent
This view communicates the major components and integration points that power Model Foundry observability.
- Where data is produced, transformed, and consumed
- How health metrics are aggregated and exposed
- How teams trace incidents to root cause faster
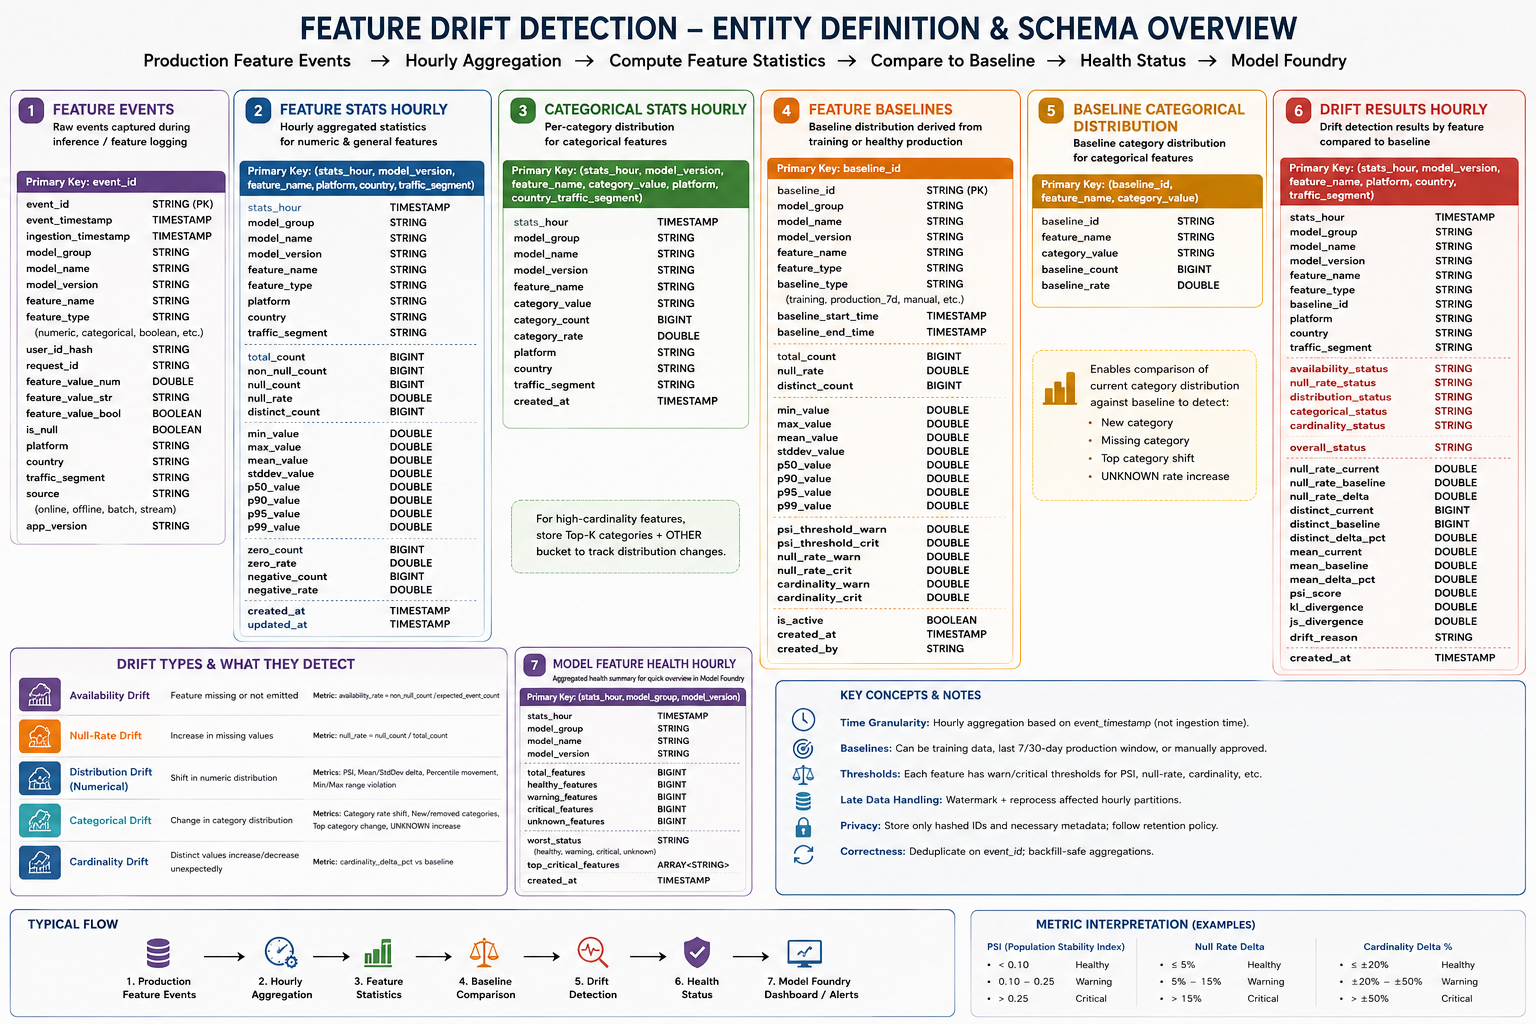
Feature Drift Monitoring
Visualizing distribution shift and model input stability
Why It Matters
- Detect changes in feature distributions early
- Protect model quality before production impact
- Prioritize investigation using drift severity signals
- Support data and model owners with clear diagnostics
Observability Metrics & Impact
Turning fragmented signals into actionable insights
Core Metrics Built
- Model Activity Detection
- Inference Latency & Performance
- Feature Availability & Health
- Dataset Freshness
- Compliance Metadata Coverage
Key Outcomes
- 12-15s → 4s page load time
- ~1s registered model latency
- 100% ownership clarity
- Single source of truth
Feature Demo
Model Definition Demo
Feature Drift
Frontend Staff Interview Story: Project Selection
Introduction framework: pick one high-impact project, frame the user decision, and define success clearly
Project Chosen: Model Foundry Observability Experience
- Business problem: model owners needed to jump across multiple tools to answer simple operational questions.
- User decision model: Is my model healthy, what changed, and what should I do next.
- Context complexity: distributed data, inconsistent health semantics, partial failures, and stale signals.
- Staff-level framing: this is not a single page build, it is a trust and decision-making system.
Your Role and Scope
- Drove information architecture, frontend contracts, and shared loading/error/freshness semantics.
- Coordinated MLOps, serving, data quality, compliance, and infrastructure partner teams.
- Guided reusable component strategy so new surfaces could adopt instead of re-implementing.
- Defined performance and reliability goals with route and section-level instrumentation.
Outcomes You Introduce Up Front
- Critical workflow improved from approximately 12-15 seconds to under 4 seconds.
- Registered model view improved from approximately 4.5 seconds to around 1 second.
- Created consistent health/freshness interpretation and reduced cross-tool debugging overhead.
- Laid reusable FE patterns that increased delivery speed and reliability across teams.
Narrative structure for interview introduction
1) Context:
Fragmented observability across model, feature,
lineage, ownership, and compliance sources.
2) Core problem:
Trustworthy decisions with partial/stale data.
3) Your leadership scope:
UX framing + FE architecture + cross-team contracts.
4) Technical strategy:
Progressive rendering, semantic health states,
URL-shareable workflows, and section-level isolation.
5) Outcomes:
Performance gains + reliability improvements +
reusable platform leverage.
Project Demo Anchor
Feature Workflow (User Decision Path)
Model Definition (Context and Ownership)
Feature Drift (Actionable Diagnosis)
Technical Deep Dive: Architecture Quality and Execution
Show clear technical quality: state ownership, failure semantics, performance mechanics, and accessibility correctness
Architecture and State Ownership
- URL state for reproducible filters and shareable investigations.
- Server-state cache for backend data, local UI state for expandable and transient interactions.
- BFF aggregation to normalize schemas and reduce FE orchestration complexity.
- Domain-neutral shared components with externalized data fetching.
- Freshness envelope and request metadata included in FE contract.
State boundary model
URL -> shareable investigation state
Server cache -> entity/health/telemetry datasets
Local UI -> expanded rows, dialogs, selection
Reliability and Performance Engineering
- Section-level boundaries isolate failures and preserve partial page utility.
- Differentiate unhealthy vs unknown vs unavailable vs stale to avoid false user actions.
- Cancel outdated requests in search/filter to prevent stale-response race conditions.
- Progressive loading prioritizes critical summary before expensive secondary panels.
- Measured improvements: key workflow down to under 4s, model page near 1s.
Reliability + performance loop
measure -> attribute -> prioritize -> rollout -> guardrail
with route-level and section-level telemetry
Accessibility and Quality Standards
- Semantic structure, keyboard-first interaction paths, and explicit labels for all controls.
- Status conveyed by language and iconography, never by color only.
- Polite live-region updates for async changes, avoiding excessive announcements.
- Charts paired with textual summaries and tabular alternatives.
- Quality checks through component testing, contract validation, and regression instrumentation.
Quality target example: 99.9% of eligible model-page visits render identity + health summary within 5s without unrecovered FE/API failure.
Organizational Depth: Influence, Adoption, and Outcomes
Demonstrate staff-level impact beyond implementation by showing cross-team alignment, migration strategy, and business results
Cross-Team Leadership and Platform Adoption
- Aligned MLOps, serving, data quality, compliance, and infrastructure on shared FE semantics.
- Created incremental migration path: reference consumers, compatibility phase, then wider rollout.
- Drove adoption through typed APIs, clear docs, examples, and support channels.
- Reduced duplicate implementations and made future page launches faster and safer.
- Converted incident learnings into reusable guardrails adopted across product surfaces.
Staff influence pattern
identify repeated pain -> define shared contract ->
pilot with 2 consumers -> measure adoption ->
standardize as platform default
Outcome Story: Technical and Organizational
- Technical outcomes: faster load times, clearer failure behavior, and improved recovery experience.
- User outcomes: shorter time to diagnosis and better confidence in health/freshness interpretation.
- Engineering outcomes: reusable FE foundations, lower implementation variance, and fewer regressions.
- Organizational outcomes: better alignment on ownership and data contracts across dependent teams.
- Interview close: emphasize measurable outcomes and how the system scaled beyond one project.
Closing line: I delivered a better user decision workflow, improved technical quality of the FE platform, and created reusable systems that increased organizational execution speed.
FE Component Architecture (High-Level SVG)
Layered architecture from route shell to rendering engine, observability, and scalable data surfaces
Why This Matters
- Separates concerns so data growth does not collapse UX quality.
- Prevents chart/render logic from leaking into route orchestration.
- Enables consistent reusable components with measurable quality.
- Builds observability and safety into every FE surface by default.
Component Development Lifecycle and Shareability
How we decide what becomes shared, and how we ship safely without over-generalizing
Component Quality Rules
- No hidden multi-service fetches inside shared visual components.
- Composition over flag explosion to keep APIs maintainable.
- Require a11y tests + contract tests before publishing as shared.
- Measure adoption, regressions, and time-to-ship as platform KPIs.
Rendering Millions of Data Points Without Blocking
Downsampling, worker pipelines, viewport scheduling, and crash-prevention guardrails
Crash Prevention Strategy
- Enforce chart render budget per route (points/frame and memory cap).
- Throttle interaction events (brush/zoom) with adaptive debounce.
- Abort obsolete query streams when user changes range/filter.
- Fallback to aggregated tiles before client reaches memory pressure.
BFF Decision Model by Data Cardinality
When FE renders directly, when BFF aggregates, and when to move to precomputed tiles
BFF Selection Criteria
- Point count and required resolution by viewport width.
- Query fanout across upstream systems and join complexity.
- Freshness SLA and frequency of updates (streaming vs batch).
- Interaction depth: pan/zoom/brush frequency and latency tolerance.
- Client memory budget for target devices and browser engines.
Deep Scroll Experience and Chart Technology Decisions
Route-level scroll restoration, viewport-triggered loading, and chart stack selection framework
Route Scroll Memory for Deep Investigations
- Persist scroll position per route + filter state key in session storage.
- Restore only after data + virtualized rows are ready to avoid jump jitter.
- Use anchor IDs for semantic restoration (section/row) when list size changes.
- Debounce scroll writes and flush on route transitions/unload.
- Support back/forward navigation with deterministic restoration behavior.
onRouteLeave(routeKey): save({ y, sectionId, itemId })
onRouteEnter(routeKey): wait(dataReady + listReady) -> restore()
if item missing: fallback(section anchor) -> fallback(y)
Chart Technology Selection Matrix
- SVG: best for low-medium points, rich semantics, and highly accessible annotations.
- Canvas 2D: better for dense continuous series with lower DOM overhead.
- WebGL: required for very high cardinality and smooth interaction at scale.
- Hybrid approach: semantic SVG overlays on top of Canvas/WebGL core traces.
- Decision gate: if expected point density exceeds frame budget, switch renderer automatically.
Operational rule: choose the simplest renderer that satisfies FPS, latency, accessibility, and maintainability constraints for expected data scale.
1 / 12